Urban Air Quality Forecasting

Overview
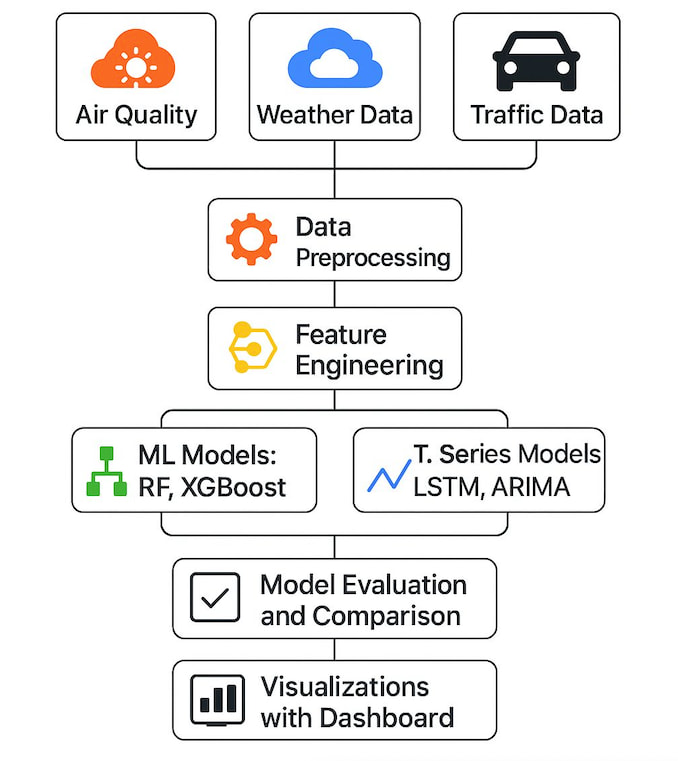
I contributed to this capstone as part of a student team (see the shared GitHub repository). The modeling pipeline centered on aligning multi-city PM2.5, PM10, and NO2 series through 2024 for New York, Chicago, and Los Angeles, merging official air-quality readings with weather fields and NYC traffic features where they improved signal, and using time-respecting evaluation splits so metrics stay honest.
Tree-based regressors (XGBoost, random forest) were run alongside sequence models (LSTM, ARIMA); RMSE and MAE were compared on held-out periods, and the strongest runs were wired into the Tableau views so stakeholders can filter by city and pollutant without opening notebooks.
Deliverables
- A Tableau dashboard with filters for city and pollutant: long-run averages, a correlation-style view across pollutants and weather, LSTM actual versus predicted series, and an XGBoost predicted-versus-actual view for quick exploration without cloning the repository.
- XGBoost and random forest regressors for level prediction, plus LSTM and ARIMA for sequence forecasting. Performance is summarized with RMSE, MAE, and related scores on time-respecting held-out splits.
- Reproducible notebooks and prepared datasets are maintained in the GitHub repository (preprocessing, exploratory analysis, and training runs).
Technology stack
- Language and environment: Python in Jupyter; Colab used where notebook GPU access simplified experiments.
- Modeling libraries: pandas, NumPy, scikit-learn, XGBoost, TensorFlow (LSTM), statsmodels (ARIMA).
- Exploratory plots: Matplotlib and Seaborn.
- Presentation layer: Tableau Public for the interactive dashboard.
- Data providers: Public air-quality monitoring records, complementary weather fields, and NYC OPEN DATA (traffic-oriented inputs where incorporated).
Interactive dashboard
The visualization is linked rather than embedded so it opens full screen on Tableau Public. Open the interactive air quality dashboard on Tableau Public.
Modeling approach
Timestamps and geography are aligned first; monitoring-station observations are merged with weather data (and NYC traffic inputs where they help). Train and evaluation splits respect time order to avoid lookahead. XGBoost performs strongly on several regression configurations (including RMSE near 4.35 in tuned runs documented in the repository). LSTM remains competitive with ARIMA on the sequential slices evaluated.
Results
- XGBoost stays accurate and stable across pollutants and cities under the tested settings.
- LSTM captures longer-horizon structure for pollutants such as PM2.5 more effectively than simpler baselines in multiple setups.
- Traffic-oriented features yield a clear lift for New York City-focused models.
- Wind speed and temperature recur as strong predictors across metropolitan areas.
Source code and notebooks are available in the GitHub repository.